ATLAS TDO Notes#
The new unit of ATLAS (in Teide) started being ingested on 2025-06-23 (MJD 60,849). Currently things are running without bespoke wallpapers, CNNs or VRA retraining. In these notes I roughly assess the effect of the addition of TDO to our data-stream and the VRA retraining strategy in the short term.
How TDO impacts the eyeball list#
Overall, the number of weekly alerts has increased by a factor of at least 2 since TDO came online. The spikes in the figure below are due to some catastrophic failures (trailing or other acute incidents), and the other smoother variations are due to the lunar cycle.
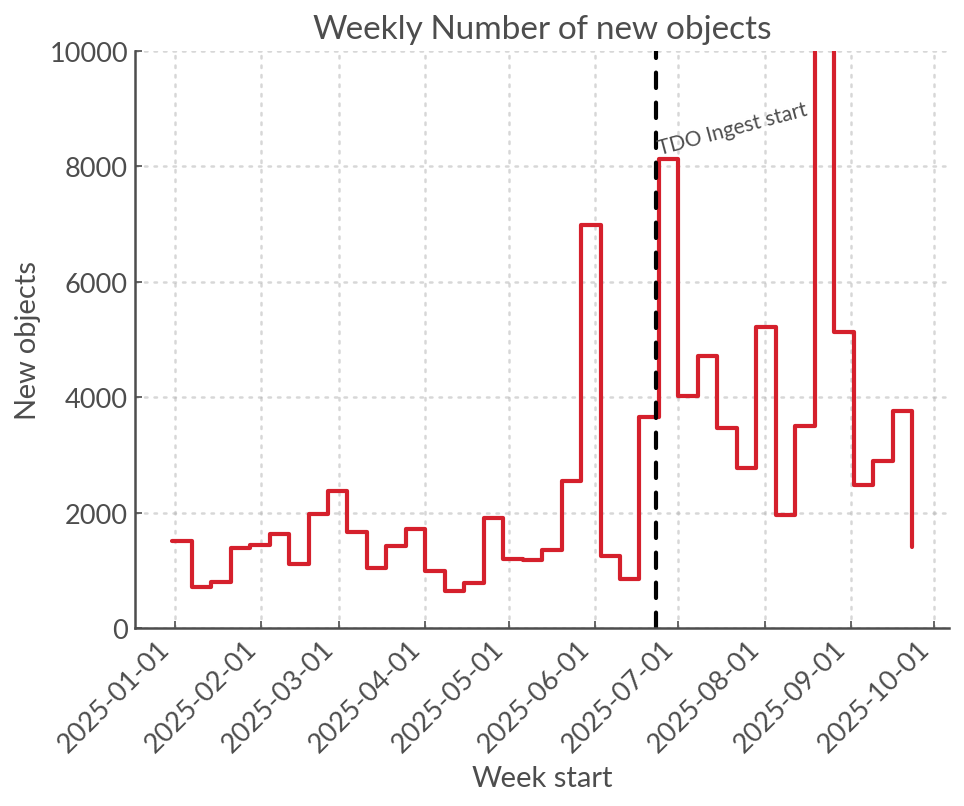
Overall, TDO contributes as many elerts to the eyeball list (after quality cuts, sherlock and CNNs) as the 4 other units.
Either TDO contributes more alerts overall, or its garbage alerts are not being filtered as effectively by quality cuts and the CNN.
How TDO impacts the VRA#
Over the past few months the purgatory has been larger than usual so we know that TDO is affecting the VRA; here we look a little closer at what is happening.
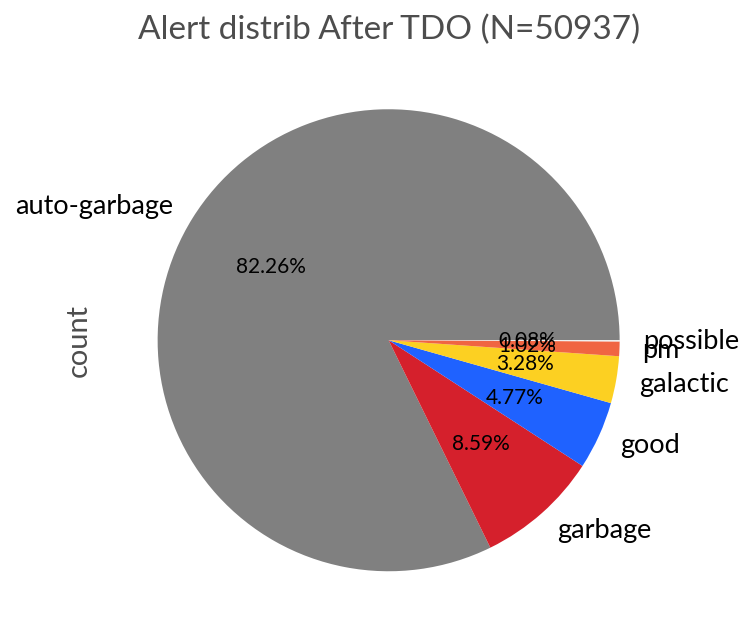
Below we have the distribution of alert labels before TDO (2025-05-01 to 2025-06-22) and after TDO (2025-06-23 to 2025-09-25). As we can see the main effect is to increase the fraction of Garbage alerts, meaning that there is more contmination in the extra-galactic and galactic eyeball lists by bogus alerts.
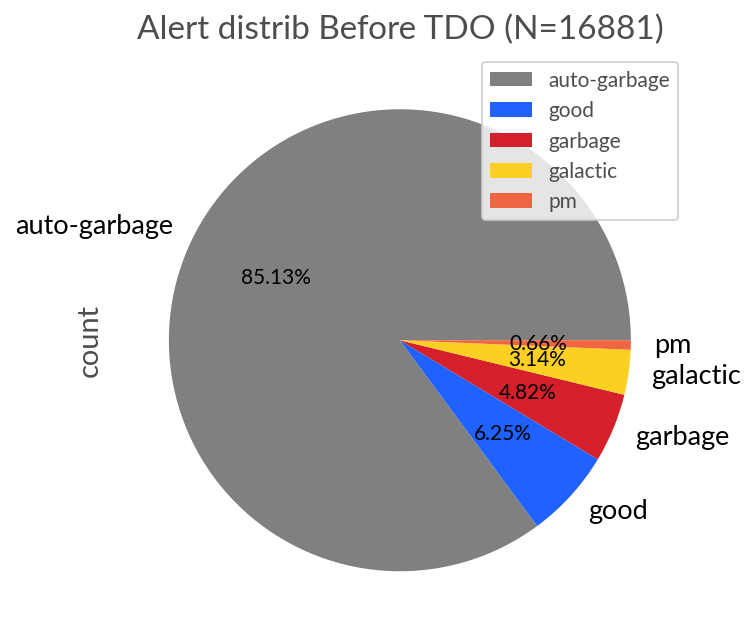
Either the VRA is worse at classifying alerts since TDO, or the increase in garbage alerts is sufficient to increase contamination. We can test this by looking at the VRA score distribution before and After TDO.
Warning
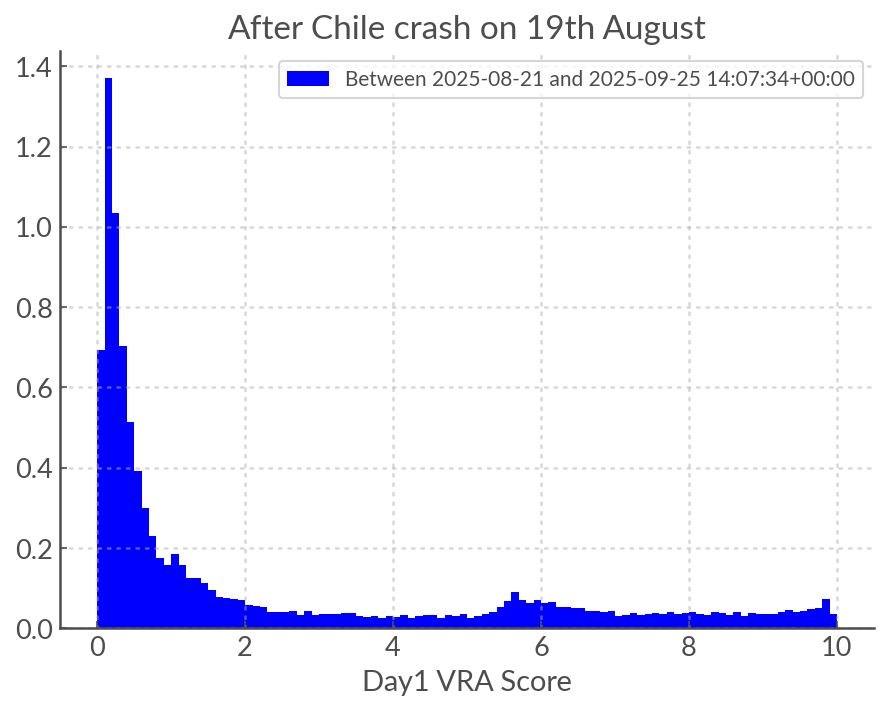
There was a catastrophic failure on 19th August leading to around 40,000 bogus alerts entering the eyeball list and receiving high VRA scores. These dates are excluded entierly from the data set and analysis below. They do not affect the pie charts above as they were not removed manually from the eyeball list and therefore did not get a human label of “garbage”.
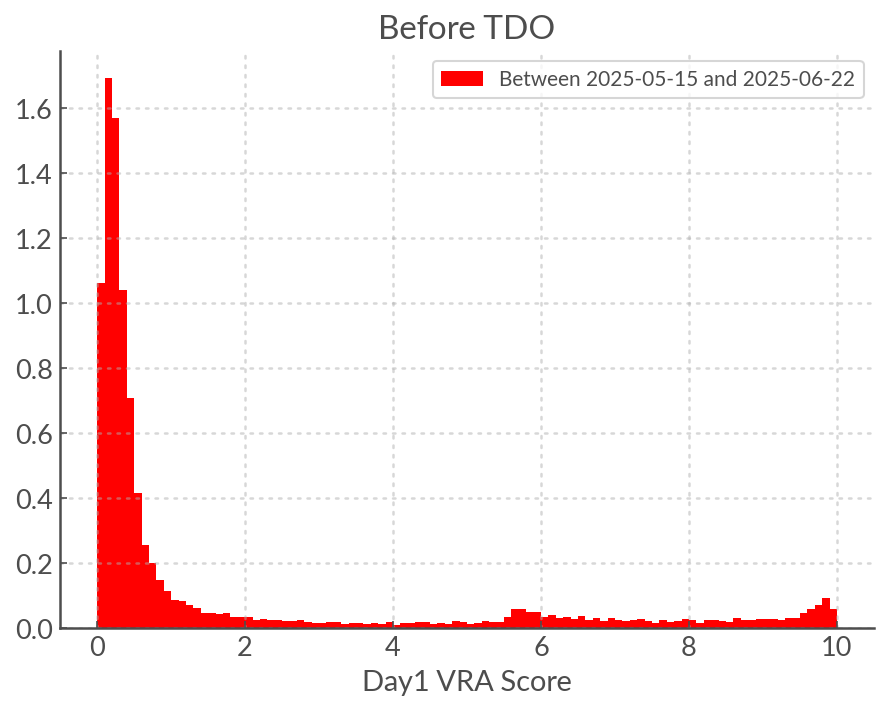
As we can see below, the VRA score distribution IS affected. The primary effect is to displace very low scores towards middling scores and the peak at high scores is diminished. The peak around VRA score 5 remains but it is there mostly by construction (Galactic list).
Note
I suspect that the “flattening” of the distribution is due to data drift. TDO does add more garbage alerts to the eyeball list overall (otherwise it would not DOUBLE its size) and sice the VRA was not trained on TDO data it would not perform as well, but in addition we may expect the distribution of some of the lightcurve features to be different for the alerts in the Northern Hemisphere, since we count for example the number of detections and non detections.
Tip
TODO: Calculate the features for ALL alerts since TDO and compare to features (ideally with statistical tests) to see which are most affected. Compare to what we know about feature importance to estimate impact.
Strategy to handle TDO#
Options#
[NOT YET] Create bespoke wallpapers to reduce bogus alert production: The bottleneck is the vetting of the images to put in the wallpaper stacks.
and the people who would do this are essentially members of the Oxford and Belfast group who are currently otherwise occupied (LSST, SoXS). For human resource reasons this is not feasible in the short term.
[NOT YET] Retrain CNNs: This will need doing anyway as each ATLAS unit has its own CNN. But it is not within my power, also requires a lot of human vetting and therefore probably only be done once, after the wallpapers are done.
[YES] Retrain the VRA: This is something I can do - hopefully relatively “cheaply” (human effort and compute).
[YES] Set new thresholds for garbaging to remove more of the purgatory: Also a cheap solution, which will be explored after retraining.